MCS Data Dashboard launches today
7 November 2022
Today, we launch the MCS Data Dashboard – the most comprehensive tool for near-real-time, low carbon technology data in the UK. For the first time ever, installation and scheme data held in the MCS Installations Database (MID) since 2008 will become available to the public.
The new MCS Data Dashboard will provide near-real-time updates on MID data, tracking the adoption of small-scale renewable installations across the UK. Given the UK’s legally binding net-zero targets, the platform will monitor the current uptake of small-scale renewables, highlight current and past trends, and identify opportunities for further development and growth. Already this year, MCS has recorded continued growth in solar PV installations with the number of installations recorded in the first eight months of this year exceeding the total number of installations in 2021.
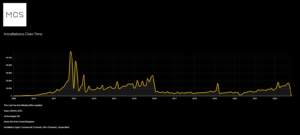 By creating dynamic visualisations, users of the MCS Data Dashboard will be able to view the uptake and distribution of small-scale renewable installations across the UK in near-real-time. Data is updated every 24 hours, instantaneously providing the most accurate picture of home-grown energy available across the industry. The platform also provides insights into the MCS certified contractor community, identifying growth and opportunities in green jobs as the volume of low carbon installations continues to increase.
The information that we provide through the MCS Data Dashboard can be used by companies, researchers, policymakers and journalists across the low carbon sector to highlight successes and opportunities in the UK’s journey to net zero.
The MCS Dashboard is divided into two sections: Installation Insights and Scheme Insights. The Installation Insights section showcases the uptake and geographical distribution of renewables, where they’re used successfully and where opportunities for growth are. Scheme Insights enables users to compare the growth of different technology types and shines a light on the contractor base installing them. Both can be filtered by year, location, technology and
installation type, with image and data exports available to download.
Ian Rippin, CEO said: “Robust data is the essence of strong decision-making. Our Data Dashboard has been a long time in the making and our efforts have paid off as we roll out our invaluable data via a real-time platform that will be a useful tool for several audiences. We believe this data will be important to people working on renewable installations and those who influence the policies for our low carbon future.
“This is why we believe it is important to make our data freely available and we encourage
anyone in the domestic renewable energy sector or working on energy system modelling to use it to their advantage.
“The MCS Data Dashboard will continue to evolve, and as we look to build its capabilities out even further we seek honest and constructive feedback from users.”
Read more about the MCS Data Dashboard, access the glossary, provide feedback and register here.